US Pharm. 2011;36(12):HS-22-HS-28.
Pharmacy technicians are an integral part of hospital health-system pharmacies. The National Association of Boards of Pharmacy defines pharmacy technician as a board-registered employee who may dispense medications, handle clinical conflict resolution, prepare IV admixtures, and prepackage and repackage medications under the supervision of a licensed pharmacist.1
The Pharmacy Technician’s Role
The pharmacy technician’s role is evolving and varies widely between the retail industry and hospital health systems, as well as from state to state. Job descriptions and responsibilities have changed considerably over the past few decades. The impetus behind many of these changes is actually the desire to redefine the role of the pharmacist. Some states are looking to broaden the pharmacy technician’s role, allowing more control and responsibility for duties traditionally performed by pharmacists, such as clarifying prescriptions, reviewing orders for unacceptable abbreviations, and entering orders. The intention of this redistribution is to allow the pharmacist additional time for the provision of direct patient care.2
To streamline the workflow and facilitate the additional duties of the pharmacy technician, increasing numbers of health care facilities are looking toward technological advances. Not only do dispensing machines and robots lessen the amount of manual labor for pharmacy technicians, they also reduce the number of medication errors, particularly those occurring at the point of dispensing. Many manufacturers state that an automated dispensing system pays for itself by reducing the costs incurred by medication errors.
Despite their benefits, however, machines rely on human intervention, and therefore the possibility of human error remains. A recent example of this was the death of a premature baby that resulted when a pharmacy technician incorrectly entered a dose of sodium chloride—60 times the ordered amount—into an automated system that prepared IV fluids.3 As long as common contributing factors exist (e.g., distractions, staff shortages), the possibility of medication errors remains. Thus, the importance of performance-improvement initiatives that focus on the staff itself, not on technology, must be emphasized within the hospital pharmacy system if medication errors are to be successfully reduced.
Medication Errors
Medication errors that occur in the hospital setting are common and have long been an area of concern for hospitals and patients. This concern is shared by private, nonprofit, and government regulatory agencies, many of which have developed guidelines and standards to address the prevalence of medication errors.
Perhaps the best definition of a true medication error is that put forth by the National Coordinating Council for Medication Error Reporting and Prevention: “A medication error is any preventable event that may cause or lead to inappropriate medication use or patient harm while the medication is in the control of the health care professional, patient, or consumer. Such events may be related to professional practice, health care products, procedures, and systems, including prescribing; order communication; product labeling, packaging, and nomenclature; compounding; dispensing; distribution; administration; education; monitoring; and use.”4
According to a 2006 report by the Institute of Medicine, medication errors cause harm to roughly 1.5 million patients annually.5 Millions more are caught prior to administration, before they reach the patient. Not only do medication errors adversely impact the patient population, they are estimated to cost billions of dollars in additional treatment costs.
One of the difficulties with medication-error prevention is that errors can occur at any point in the multistep and multidisciplinary process of medication delivery and administration. The medication errors discussed in this article include only those that have not reached the patient and therefore did not cause or contribute to an adverse drug reaction or adverse drug event. The National Coordinating Council for Medication Error Reporting and Prevention recommends that pharmacy departments collect and analyze data on preventable medication errors and use them in their quality-improvement initiatives.6
Performance-Improvement Project
Wentworth-Douglass Hospital is an acute-care facility with 178 beds and more than 2,000 employees. The pharmacy operates 24 hours a day and employs eight clinical staff pharmacists, two overnight pharmacists, and three pharmacists in leadership roles. Also on staff are eight full-time pharmacy technicians, three part-timers, and one part-timer on call; nine technicians are certified by the New Hampshire Board of Pharmacy.
In April 2008, the hospital’s pharmacy director and data analyst initiated a performance-improvement project focused on rewarding pharmacy technicians for their accuracy in manually filling cassettes during cart fills. Wentworth-Douglass Hospital currently does not utilize carousel technology or other automated dispensing systems. Each patient’s medications are filled with a 24-hour supply exchanged daily using computer-generated refill sheets. It was expected that the project would reduce medication errors occurring at the dispensing point of the medication-delivery process.
Pharmacists were responsible for recording errors found during their manual checks of the cart-fill cassettes. Seven types of errors were examined and recorded in this process: wrong drug, wrong dose, wrong patient, wrong route, missing medication, labeling, and other. The data were tracked and assessed by the data analyst, who used a secure spreadsheet document.
Year 1: The first year of the project included a trial of a Technician of the Month incentive program based solely on the accuracy of each individual’s cart fills. The technician with the lowest error rate at the end of the month earned the title Technician of the Month and received a small nonmonetary prize. Technicians were encouraged to compete for the lowest error rate. The data analyst developed and distributed monthly reports to each technician showing the individual error rate and how he or she compared with his or her peers via a blinded graph. The technician’s strengths and opportunities for improvement were included, for example, the error types with the lowest and highest error rates and a trended graph depicting overall progress. These reports were also distributed to the pharmacy director and the lead technician. At the end of year 1, the project was evaluated by the director, data analyst, and lead technician to identify successes and failures.
During the first year, no real improvement was seen, with the overall error rate remaining steady (FIGURE 1). Feedback from technicians indicated that the incentive itself failed to inspire them to compete for the lowest error rate. Additionally, the award was typically achieved by one of two technicians whose performance was consistently on target, so much so that the prize was always just beyond the grasp of the other technicians despite their improvement. In essence, the contest rewarded those technicians already performing to goal level and did not reach the targeted population.
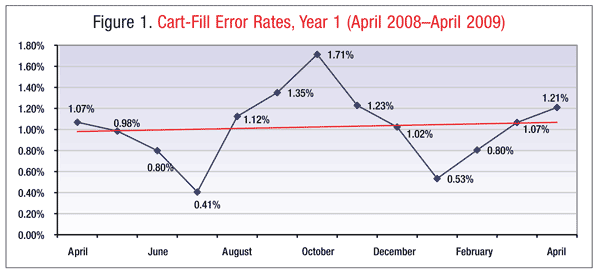
End-of-Year Conclusions, Year 1: Despite the flaws identified, the project spurred an increase in dialogue between pharmacists and technicians during the manual checking process. The National Coordinating Council for Medication Error Reporting and Prevention recommends that education on medication-error prevention be provided on an ongoing basis for all staff.6 Analysis of the project revealed that pharmacists often reviewed medication errors with technicians at the time of the error, which proved helpful for preventing errors. However, this was not always possible because of workload and time availability; therefore, one-on-one dialogue at the time of the error could not be incorporated as a mandate of the project.
Year 2: In summer 2009, the Technician of the Month award was removed from the performance-improvement project, but error rates continued to be tracked. Several ideas were suggested to improve the static error rate. In October 2009, in an effort to reduce the overall error rate of 1.07% (April 2008–August 2009), it was suggested that the timing of cart fills be changed from evening to early morning. The intention was to shift the task to a time when more staff were available (up to five day technicians vs. two evening technicians), thereby increasing the importance of the job.
The performance-improvement project was reviewed again toward the end of year 2. A few of the primary failures found during year 2 echoed those of year 1. Technicians were discouraged by their inability to decrease their cart-fill error rates enough to surpass those few technicians who consistently achieved a near 0% rate.
Additionally, year 2 was one of personnel transition. During the year, the lead technician asked to step down and return to the regular position of pharmacy technician. Department leadership recognized that the job of managing the technicians was too extensive for a pharmacy technician, and the director began investigating replacements.
The most significant improvement during project year 2 occurred after cart fills were moved from evenings to mornings (FIGURE 2). The cart-fill error rate dropped nearly 50% in November 2009 compared with the prior month. The most readily identifiable contributing factors to this substantial improvement were increased staff and fewer distractions at the time that carts were filled.
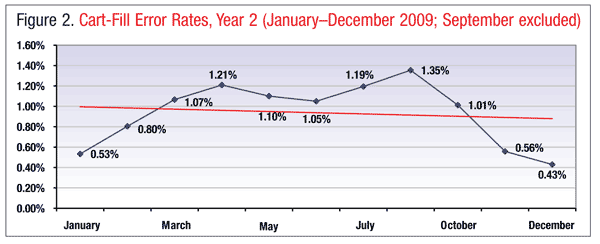
End-of-Year Conclusions, Year 2: Although changing the timing of cart fills was clearly successful, the structure of the project still needed revamping. The overall error rate was declining, but individual error rates continued to be closely monitored. Individual improvement still was necessary, as was maintaining the current momentum. Therefore, it was suggested that technicians be given a higher level of accountability. Toward the end of 2009, the decision was made to incorporate error rate as a key measure in the annual performance evaluation of all technicians.
Year 3: In January 2010 the lead technician officially stepped down, and a staff pharmacist was promoted to operations supervisor in charge of all technicians. The new operations supervisor immediately began an intensive review of cart-fill error rates. This included one-on-one monthly communication with the technicians regarding their individual error rates, with both praise and suggestions for improvement offered, if needed.
In February 2010, each technician’s cart-fill error rate was incorporated into his or her annual performance evaluation. To effectively accomplish this, the operations supervisor made the cart-fill error rate a goal for those technicians whose error rates needed improvement. If by the next evaluation the technician’s error rate had not improved by the predetermined amount, he or she would be marked as having an unmet goal, resulting in a 0.5% reduction in the overall merit score. This strategy meant that improvement was compared against the technician’s own performance, rather than the performance of others who could not be matched. In this way, the progress of individual technicians was acknowledged even if they did not surpass the lowest error rate. This individualized approach provided the impetus for technicians to have a vested interest in reducing their cart-fill error rates.
Additionally, in September 2010, the operations supervisor moved one technician to the night shift (9 pm–7 am) Tuesdays through Fridays. With this change, the cart-fill responsibility was shifted to the night shift 4 days per week. The structure of the night shift provides for a significant distraction-free time frame dedicated solely to cart fill. This scheduling change resulted in a dramatic reduction in cart-fill error rates of almost 50% compared with the previous month (FIGURE 3).
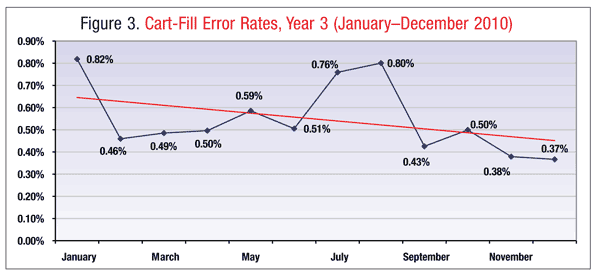
End-of-Year Conclusions, Year 3: At the end of year 3, the error rate had significantly decreased and continued to trend downward. Key factors in this successful result were creating the position of operations supervisor, including error rate in the annual performance evaluations, and transferring one technician to the night shift. As year 4 was entered, the focus would be on continuing to improve the cart-fill error rate and maintaining the technicians’ interest in improving their personal performance.
Year 4: This year began during a time when the hospital was regularly reaching surge capacity. This situation continued periodically over the first few months of 2011. When the hospital was at surge capacity, staff were stretched to meet the demands of the high volume of medications. The pharmacy data analyst tracked the dates surge capacity was reached to locate trends in error rate. It was expected that error rates would rise with the increase in workload; however, overall error rates continued to trend downward at an impressive frequency (FIGURE 4).
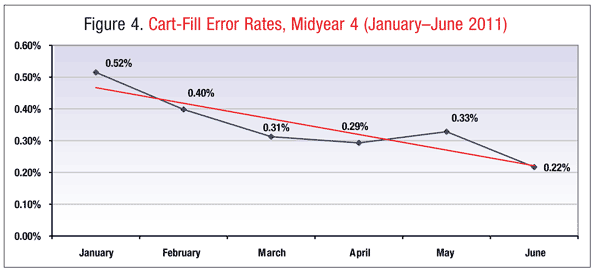
Midyear Conclusions, Year 4: At midyear 2011, the project’s focus was on maintaining the current low error rate by providing incentives, such as a free lunch, when the technicians reduced the overall error rate by a predetermined target. With this focus on overall error rate by all technicians, the project is incorporating an emphasis on teamwork in addition to individual improvement. Error rates remain a goal in technicians’ annual performance evaluation—an identified successful technique.
Comprehensive Analysis: For the period of April 2008 through June 2011, a total of 5,274 medication errors were averted at the dispensing level out of 727,756 line items filled, for an overall error rate of 0.72% and accuracy rate of 99.28% (FIGURE 5). Of the different error types reported, wrong dose and missing medication (i.e., the technician missed filling it in the cart-fill cassette, potentially delaying treatment) were the most common error types. The lowest error type was wrong patient.
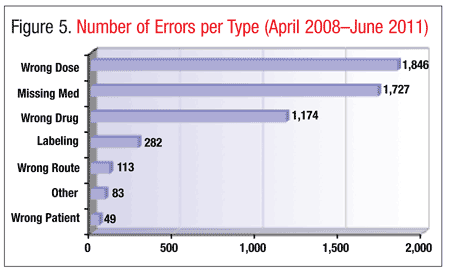
Wentworth-Douglass Hospital achieved its lowest error rate yet—0.22%—in June 2011. The operations supervisor reinstated the Technician of the Month award. The award is not based solely on error rate, although a technician may receive the award because of an outstanding error rate.
Conclusion
In review, the pharmacy department’s performance-improvement project has been deemed successful, as error rates decreased significantly and have been maintained at this acceptable level. The most important characteristic of the project was its fluidity. The project was regularly analyzed with regard to its successes and failures, and changes were made to promote its triumphs and reverse its shortcomings. Input from technicians was elicited, considered, and used to make the project more effective.
Overall, Wentworth-Douglass Hospital’s current success in reducing medication errors at the point of dispensing may be attributed to three key pieces of its performance-improvement project: accountability, limitation of distractions, and follow-up. It is clear that significant reductions in error rates occurred when technicians were held accountable for their individual rates via their annual performance evaluation. One-on-one feedback that was constructive, supportive, and positive was more effective than the impersonal reports given in years 1 and 2. Perhaps the most significant factor in reducing the cart-fill error rate was shifting it to the duties of the overnight technician 4 days per week. Allowing an extended time frame for focused, methodical work proved to be effective in substantially reducing the overall cart-fill error rate.
Successful reduction of medication errors depends upon limitation of distractions, constructive follow-up, and accountability. When these three points are put into practice in a quality-improvement project, given strong leadership, successful prevention of medication errors can be achieved at the point of dispensing.
REFERENCES
1. Catizone C. Model State Pharmacy Act and Model Rules of the National Association of Boards of Pharmacy. Mount Prospect, IL: National Association of Boards of Pharmacy; 2010.
2. Council on Credentialing in Pharmacy. Scope of Contemporary Pharmacy Practice: Roles, Responsibilities, and Functions of Pharmacist and Pharmacy Technicians. Washington, DC: Council on Credentialing in Pharmacy; 2009.
3. Graham J, Dizikes C. Baby’s death spotlights risks linked to computerized hospital systems.
http://seattletimes.nwsource.
4. National Coordinating Council for Medication Error Reporting and Prevention. What is a medication error?
www.nccmerp.org/
5. National Academies. Medication errors injure 1.5 million people and cost billions of dollars annually; report offers comprehensive strategies for reducing drug-related mistakes.
www8.nationalacademies.org/
6. National Coordinating Council for Medication Error Reporting and Prevention. Recommendations to enhance accuracy of administration of medications.
www.nccmerp.org/council/
To comment on this article, contact rdavidson@uspharmacist.com.
