US Pharm. 2011;36(6)(Generic Drugs suppl):8-9.
Health care spending by the federal government, patients, and third-party payers is driven by many factors, including the price paid for the prescription drug dispensed. In 2009, total spending on prescription drugs was $250 billion, of which $78 billion (about 31%) was paid by the federal government.
The Government Accountability Office (GAO) is an independent nonpartisan agency that, on behalf of Congress, is responsible for investigating how the federal government spends taxpayer dollars. In 2010, Congress asked the GAO to track government auditing standards and to report on the following for the period between January 2006 and January 2010: (1) trends in drug prices for brand-name and generic pharmaceuticals and (2) the extent to which prices for individual brand-name drugs changed over the course of the assessment period. To accomplish this, the GAO examined usual and customary (U&C) price trends for the 100 most commonly used prescription drugs and analyzed trends using prices other than U&C. Data on 5 million patients from retail pharmacies in the PACE prescription drug program were analyzed.
Basis of Cost Comparisons
According to the Centers for Medicare and Medicaid Services (CMS), 65.5% of the total number of drug fills were for the top 100 drugs prescribed, and these drugs accounted for 67% of total gross drug costs. For evaluation, the GAO used average wholesale price (AWP; the list price reported by the manufacturer), average manufacturer price (AMP; the average price paid to the manufacturer by wholesalers and other purchasers), and Medicare Part D plan price (the price negotiated between participating Part D plans and pharmacies for consumers). AWP data (based on National Drug Code numbers) were from the Red Book, and AMP and Part D plan data were from the CMS. To study U&C price trends, the GAO calculated quarterly price indexes of the average price of drugs. For each index, the first quarter of 2006 was considered to be a baseline with an assigned value of 100, and the change over each quarter was calculated as an expressed value above or below 100.
The GAO’s Findings
The U&C price index for the 100 most commonly prescribed drugs (55 brand-name, 45 generic) increased by 6.6% annually from 2006 through the first quarter of 2010. This exceeded the yearly 6% increase from January 2000 to January 2007, when an annual 3.8% rise occurred in consumer prices for medical goods and services. The cost index of brand-name drugs increased by 37.7% between the first quarter of 2006 and the first quarter of 2010, for an average of 2.4% per quarter. During the same period, however, the generic drug index decreased at a rate of 0.6% per quarter. These comparative figures show that the rate of increase (2.4%) per quarter for brand-name drugs significantly outpaced the rate of decrease (-0.6%) for the generic drug price index, with a net change of 1.8%.
Shift From Brand to Generic
Reimbursement formulas used by third-party payers were modified in the mid-1990s to reflect use of the most cost-effective drugs to treat a disease. The GAO’s analysis revealed evidence of the growing national shift in consumer utilization to generic versions of the 100 most commonly prescribed drugs based on their active ingredients. The U&C price index for the 55 brand-name drugs increased by an average annual rate of 8.3% during the study period; by contrast, the U&C index for the 45 generic drugs decreased by 2.6%. When shifts in consumer utilization to generic versions of drugs (selected by active ingredient rather than drug name) were considered, however, the U&C price index increased by about 2.6% per year, a much lower rate than the increase observed when shifts in utilization were not included.
Some media reports have suggested that prices for brand-name prescription drugs rose at a faster rate than costs for other medical expenses because of the debate surrounding the passage of the Patient Protection and Affordable Care Act (PPACA) in March 2010. The PPACA does not set limits on the price at which a drug may be marketed, but it does require the drug industry to pay more than $80 billion in rebates (in the form of discounts and taxes) toward the cost of the health care system over a 10-year period.
U&C, AMP, and Part D
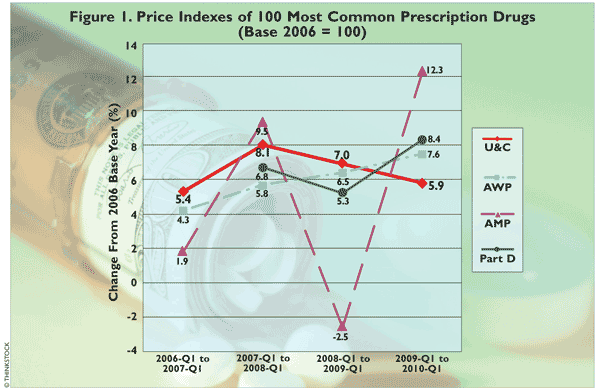
Pricing trends for the 100 most commonly prescribed drugs, when computed according to prices other than the U&C index (FIGURE 1), also increased from 2006 through the first quarter of 2010, but more slowly than the U&C rate of 6.6%. For example, the AWP index increased at an average annual rate of 6.0%, whereas the AMP index increased at an average annual rate of 5.3%. The Part D index (measured from 2007 through the first quarter of 2010) increased an average of 6.8% annually, slightly less than the U&C index of 7.0% when measured across the same period.

Pros and Cons of Price Changes
When considering the shift in prices of brand-name and generic drugs between 2006 and 2010, one should keep in mind that the GAO’s calculations do not take into account dollars received from PPACA rebates. The CPI-M (Consumer Price Index for prescription and nonprescription drugs, medical equipment, and services) and the CPI-U (CPI for all goods for urban consumers) are computed by the Bureau of Labor Statistics. Between 2006 and 2010, the CPI-M was 6.5% of the CPI-U, and prescription drugs accounted for 18.8% of the CPI-M, which translates to 1.2% of the CPI-U. While the CPI-M was only a small percentage of the CPI-U, the contribution of the remaining 93.5% of the CPI-U to the rising cost of national health care must be analyzed. The net effect of the increase in brand-name drugs and the decrease in generic drug prices could eventually affect the overall health care cost to the nation.
Because the GAO’s analysis was limited to the most commonly used prescription drugs in the relatively large nationwide insurance plan, caution should be exercised in generalizing to all drug prices. In any case, the importance of the cost of drug therapy remains a significant concern as the U.S. population ages. Not only does a price increase threaten to restrict individual access to a drug, it also places a heavy burden on third-party payers, which in turn costs the nation more health care dollars.
To comment on this article, contact rdavidson@uspharmacist.com.


